Charge & Cost Measure calculations
This information is also available on our Downloadable fact sheets page or you can download this PDF.
At Syntellis Performance Solutions, LLC, we strive to make your data versatile enough to provide concise answers to your specific questions. To do that, all of our calculations are done at the encounter level, then, in Clinical Analytics, you can pull only the cases relevant to your request to provide a more precise and applicable answer.
Cost/charge calculations appear throughout Clinical Analytics, but we use the Charges and Costs Detail section in this example. To walk you through what you’re seeing on your scorecard, let’s talk through the calculations at the patient level, then take a look at what you’ll see for a profile. This document guides you through understanding the Cost calculations; the logic is the same for Charges. To begin, navigate to a Charges and Costs Detail section in any scorecard, or add one to the scorecard of your choice.
For patient-level data
We refer to this single encounter to understand the calculations, then scale up to what you see for a typical profile. If you’d like to replicate a similar view, create a profile with a single encounter.
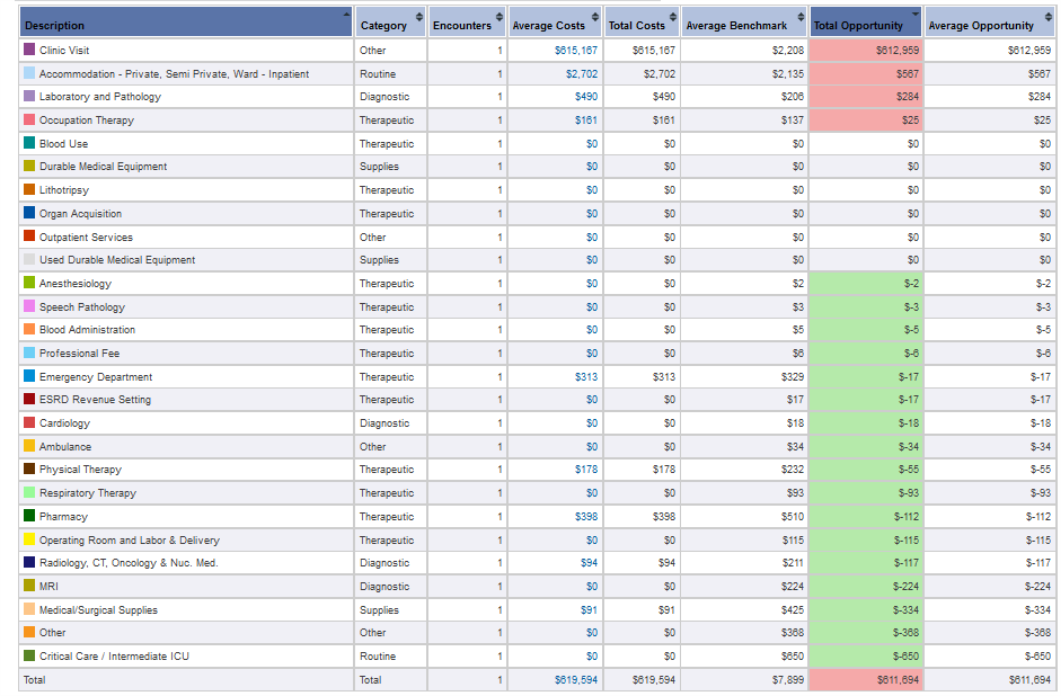
Description: The farthest-left column gives a list of cost centers which are each assigned to a Category. Let’s take a look at the “Clinic Visit” cost center (top row) to see what each of these columns represents.
Encounters: Indicates the number of cases in the patient population for these calculations (at the case level, this is 1 because you are only looking at the one encounter). The values in this column are blue to indicate that they are hyperlinked. Clicking one of the values drills in to a Details section view of that domain.
Total Costs: Sum of all costs for that cost center. Here, Total Costs=$615,167.
Average Costs: Total Costs/Encounters. Here, Average Costs=615,167/1=$615,167.
NOTE: At the encounter level, Average Costs equal Total Costs, because Encounters=1.
Average Benchmark: Fixed number calculated by our software based on the chosen time Period, Benchmark Profile, and Benchmark Period at the top of the scorecard section. This number takes into account our database of records in the chosen peer group. It is important to note that the benchmarks are risk-adjusted based on whether you selected MS-DRG or APR-DRG as your Grouping Type when creating your profile. A benchmark value is determined at the given percentile for the DRG stratification level of each encounter. All of these benchmark values are then averaged across all encounters in the chosen profile; see Benchmark calculations and Cost benchmarks for more information. Here, Average Benchmark = $2,208.
NOTE: About Calculating Benchmark Quantiles: Quantiles are cut-points in the data that divide the range of values into equal probabilities. Clinical Analytics Software chooses to cut the data into 5% intervals (1% chunks are called percentiles). All values in the database for the measure are ordered from least (0th percentile) to greatest (100th percentile), then the system sets the 5% quantile cutoffs. When you request a particular quantile, the value you see is greater than the chosen percent of the data.
Total Opportunity: for each encounter, we calculate the difference between the total costs for that cost center and the benchmark value for that DRG stratification level. These differences are then summed together to get the Total Opportunity for that cost center. At the patient level, this value is the difference between what that patient’s encounter cost your facility and the average benchmark for your peer group. A red (positive) value indicates costs greater than others in your peer group; a green (negative) value indicates costs lower than those of your selected peer group. Here, Total Opportunity=$612,959.
Average Opportunity = Total Opportunity/Encounters. At the patient level, because Encounters=1, Average Opportunity is equal to Total Opportunity. Here, Average Opportunity= 612,959/1= $612,959.
For more than one encounter (most profiles)
When we consider multiple cases, the same interactions between the columns still apply on the patient level, as described above, but we are now taking into account all Encounters within the indicated time Period for your selected Profile (note that Encounters should now be greater than 1). The important difference you may notice when you zoom out from the case-level to look at all cases included in the selected Profile is the cost center row titled Total.
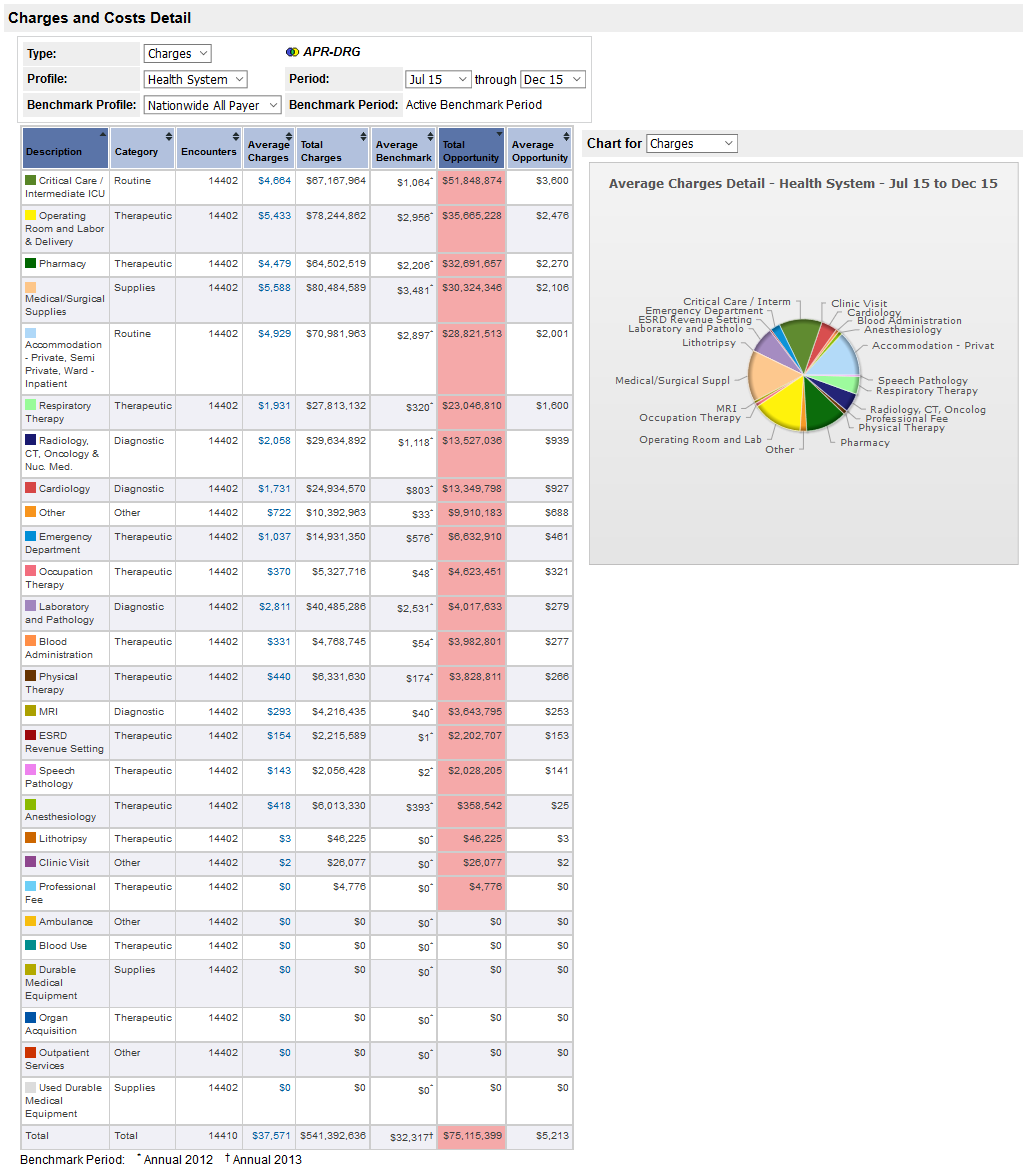
The Total row
At the bottom of the cost center list, there is a row labeled Total. It is important to think of the Total row as a cost center of its own (it even has its own Category). While it seems natural to add all the values in a column to arrive at the Total, there is not a viable interpretation for this because of the way the other rows are constructed.
Review columns in terms of the Total row
Encounters for the Total row is not always the same as the Encounters value for the rest of the cost centers. The Total number of Encounters includes all cases submitted to us in your data that are applicable to your selected Profile; the number of Encounters for the remaining cost centers includes only cases from the selected Profile that were included in one of the listed cost centers. Cost centers are assigned based on revenue codes and occasionally discrepancies in the submitted data can cause these numbers to not match up. Contact Support to let us know if there are large discrepancies in these values so we can discuss your data. In this example, we see that there are 8 encounters included in the Total row not included in the other cost centers.
Total Costs: Sum of all encounter-level Total Costs values for all included cases; this should be roughly close to the actual sum of the Total Costs for each other cost center you see in the table.
NOTE: If the Encounters values are different, this value reflects that, as it is also including costs for any encounters not in the listed cost centers.
Average Costs: Total Costs/Encounters. This is the exact result of dividing the given values from the Total row.
Average Benchmark: Calculated the same as previous, noting that Total is its own cost center with its own Benchmark value; this is why strictly summing the columns to the right of this value does not equal the given value in the TotaI row. The Benchmarks come from a complex calculation and there is not a meaningful interpretation for the sum of benchmarks, so Total is a separate benchmark calculation.
Total Opportunity: For each encounter, we calculate the difference between the total costs for that encounter and the benchmark value for that DRG stratification level. These differences are then summed together over all encounters to get the Total Opportunity for that cost center. A red (positive) value indicates costs greater than others in your peer group; a green (negative) value indicates costs lower than those of your selected peer group.
Average Opportunity: Total Opportunity/Encounters. When positive, this number indicates patients costing more, on average, than patients among your peer group; when negative, this indicates costs being less, per patient, than your peer group.
